Be yourself; Everyone else is already taken.
— Oscar Wilde.
This is the first post on my new blog. I’m just getting this new blog going, so stay tuned for more. Subscribe below to get notified when I post new updates.
IF YOU WANT TO CHANGE THE WORLD, PICK UP YOUR PEN & WRITE.. (Martin Luther)
Be yourself; Everyone else is already taken.
— Oscar Wilde.
This is the first post on my new blog. I’m just getting this new blog going, so stay tuned for more. Subscribe below to get notified when I post new updates.
Few days back when I was doing a DS course from uaceit.com ,I learned making my very first data science project on Jupyter Notebook using an effective ML algorithm i.e. Linear Regression. I learnt understanding data and how we can relate it to get better and desired outcomes. Linear Regression can be defined as “An approach that models a change in 1 or more predictor variables(say x) that produces a linear change in the response variable(y)“
Lets get started step by step from scratch
STEP 1 : READING AND ARRANGING DATASET IN PROPER FORMAT
In the 1st step ,I imported pandas library to read dataset with its read.csv() function. The dataset is taken as a link in the address variable. Since the data was raw containing unnamed & unseparated columns ,So it was converted in a readable form. Then stored as Dataset.csv onto my local machine.

STEP 2: MAKING EXPLORATORY ANALYSIS ON DATA
EDA generally called as Exploratory Data Analysis is a kind of statistical study that is done on data sets to figure out main characteristics and perform hypothesis as required. For that ,we require data visualization library i.e. seaborn to understand the relationship between the different data points/predictors. Info() and describe() functions were used to see where the distribution points lie and the range of the dataset. Since the graph showed symmetrical sign it is observed that the predictors are linearly related with the target variable.

STEP 3: ANALYZING THE CO RELATION BETWEEN VALUES IN A DATASET
To visualize co relation values(from -1 to 1) between predictor and target variable we use heat map() function and corr() function of our data frame to see results.
1 means =>perfect positive linear relationship
-1 means =>perfect negative linear relationship
0 means =>no relationship at all
Consider the last row for better understanding , MLDGP shares the highest positive linear relationship with target variable(0.54) and GATS1p shares the highest negative linear relationship (-0.31)

STEP 4: MODELLING DATASET USING LINEAR REGRESSION
For training and modelling dataset, we will use sklearn python library. We will import StandardScaler () and train_test_split() function from preprocessing and model_selection sub modules of sklearn.
The dataset is divided into 2 parts for training:
X => for displaying the feature variables(independent)
Y => for displaying the response variable(dependent)
Here, another important concept that needs to be understand is of Scaling .We use the feature scaling technique to standardize the independent variables present in a dataset to a fixed range of minimum and maximum values of 0 to 1.This is done using StandardScaler() function.

Moreover, the train_test_split() will divide the dataset into two subsets 70% for training and 30% for testing model.

After that, we will apply LinearRegression() method from model selection sub module. The fit method takes 2 arguments for training(input and output) as supervised learning gives predictions on mapping input to output based on randomly organized training sets. We will then apply predict() method for our model to make predictions.
By checking residuals i.e. difference between the observed y-value (from scatter plot) and the predicted y-value (from regression equation line),we will see how appropriate our model and assumptions are .

Since, residuals are randomly placed, above and below x-axis(regression line), it is confirmed that our model is Linear Appropriate. This means that a residual may have a positive, negative or zero values.
A linear regression requires residuals to be normally distributed with a mean of 0. Residuals have the same distribution for all values of the explanatory variables. But here we see that our distributed values differ means that the model is biased and we need to revise the model. Problems like overfitting or multi collinearity limits the effectiveness of this algorithm.

Each time the model is fitted ,it trains a random subset and gives a different accuracy score. The model is able to predict only 40 to 60 % of the target variable which is quite low. In short, the fact that the residuals were not equal to 0 has affected the accuracy rate of the model .You can find the code link at the end of the blog.
One way to address the problem is simply removing those data points which are too distant from the mean of data or we can increase the complexity by adding the number of predictors into dataset.
Other algorithms like KNN-regression, LASSO or Ridge Regression can also be fitted on the model as alternatives to apply regularization to the dataset and improves its accuracy. To learn more about this technique you can follow the links below.
Until then stay connected for new data insight stories!
Have a Good Day 🙂
Source:
Project:–>https://uaceit.com/courses/your-first-data-science-project/ &
–>https://datatofish.com/multiple-linear-regression-python/
Linear Regression: https://en.wikipedia.org/wiki/Linear_regression
GITHUB repo: https://github.com/ToobaAhmedAlvi/1stDSproject
Computer Science is the oldest and probably the first computational field made from conceptual theories of mathematics,physics and mechanical inventions.Computer Science can be referred as the initial building blocks towards technological advancement of Computers.Whereas Data Science evolved dramatically in the recent history (Approx 30 years) making itself the most demanding and highly paid technical field.Though a subset of CS,it is very helpful in maintaining and processing large modules of data.
TORTURE THE DATA AND IT WILL CONFESS TO ANY THING.
-RONALD COASE(Noble Prize Laureate)
Data Science has a moderate history but here I will mention the important years and their proceedings.At initial,’data logy’ was used as a term for data processing methods in 1960 by Peter Naur. But later on,the whole concept changed and an individual field emerged naming as Data Science in 1996 by Chikio Hayashi at International Federation of Classification Societies (IFCS) conference with title “Data Science, classification, and related methods” marking history as never before!The term was thus coined at the beginning of the 21st Century by William S. Cleveland in 2001.Data Science was then termed as the field that contains an inter relationship between Statistics,Mathematics and Computer Science to analyze and model data.In January 2008,JISC(Joint Information Systems Committee) concluded Data Scientists as the individuals that have a deep knowledge and strong sight on statistical analysis such as Data Mining,Big Data and other data base developments.

The data Science jobs came in market back in 2010 when different government & research sectors needed collaborations to handle Big Data and do inquiries to manipulate data infrastructure by generating analysis reports.The young profession requires a constant improvement in terms of data visualization and analysis across all fields.Behind a posted tweet,your search history and ID scan ,there are numerous algorithms implemented to help you with the most accurate real time results and fastest bundle of data.It would not be wrong if we say that statistical analysis is the most necessary component to implement best versions of Data Manipulation.
Data Science is creating an endlessly growing environment for the industry since it has a great impact on IT.Artificial Intelligence is promoting Data Science via Machine Learning and Deep Learning making Smart & Human friendly inventions .
Have a look at few projects Of AI in different Domains:
The new taste of neural networks such as TensorFlow,Keras,Bayesian with data-driven & evolutionary algorithms are convincing to believe that the the time is not far when these inventions will exceed the processing power of human brain!
After reading this blog, we can understand why AI means the future.I’ll come with some more interesting facts and inspirational personalities.Until then stay connected!
Have a Good Day 🙂
Source:Google,forbes.com & Wikipedia
Have you ever spent a day without opening Google Chrome or Mozilla Firefox?Have you ever searched about some ambiguous stuff without tapping the google icon?If yes then you are not the part of this magical world and have never felt the wonderful feeling by getting hundreds of results appear at a blink of an eye on just 1 click and all this happens with the smartest inventions of Search Engines & Web browsers.These two are not only helpful for us but also necessary for each other.
But do you really know the exact difference between the two?If not,then you really don’t need to worry because this blog will answer all your queries and after that, you’ll enjoy using them.
A Search Engine is actually a web service or a web based tool that helps you to open other web pages offered by various web servers of your choice.But that is the exact thing a web browser does!Well it is not.A Web browser is a local machine installed on your computer that gives you access to different websites and web pages whereas a search engine looks for a particular stuff to your requested query,goes through a priority algorithm to locate the best and relevant results with the available documents or text on the internet and ends up by displaying them in front of you.Both are software programs but you can never approach to a search engine and to the internet without a web browser.
Google,Bing,DuckDuckGo & Yahoo are the common examples of search engines where Google being the most popular,covers 90% of the market share globally.
Most of the web browsers use Google as their default search engine due to its best search results(SERPs),excellent and quick service.Here is the list of top 5 Web browsers & their market shares. (February 2020)

So,in spite of just googling entertainment news,shopping trends and research materials,make yourself well aware of what it actually is!
After reading this blog, we can draw a clear line between the two and should realize how they have become an active part of our everyday life.I’ll come with some more interesting facts and inspirational personalities.Until then stay connected!
Have a Good Day 🙂
Source:Google & differencebetween.net
Technology feeds on itself.Technology makes more technology possible
-Alvin Toffler
All it started with an 8 letter word i.e computer.A computer is nothing but an invention of technology.As the name defines “compute” as doing numerous calculations,making sensible decisions and performing number of tasks.In technology,a computer is an electronic device that can perform mathematical,logical and complex operations faster and more accurately than a common man. A computer will perform all the tasks as per the instructions you provide via input devices converting them into signals/binary language which only a computer can understand.
So,when I was taught about the basics of computer in grade 4,I was also taught about the system software and application software.There’s a common difference between the two.A computer can’t function without a system software as it manages the computer hardware and operates different application or software resources providing common services for all computer programs.Whereas an application software is used to perform some specific and special tasks as per the need and user’s requirements.They can be database programs, word processors, Web browsers and spreadsheets.But a System software includes operating systems like mac OS, GNU/Linux and Microsoft Windows installed on the computer.
The most popular and in demand application software back in 2006 was MS office 2003 with an updated version (2005) due to its user friendly environment ,excellent performance and better compatibility requirements.
The image shows the names of Windows platforms MS Office 2003 was supported with technically strong network and sound storage space.
Coming back towards my technological journey ,I was taught about three most commonly used applications of Office 2003 that were Microsoft Word,Microsoft Power Point and Microsoft Excel.
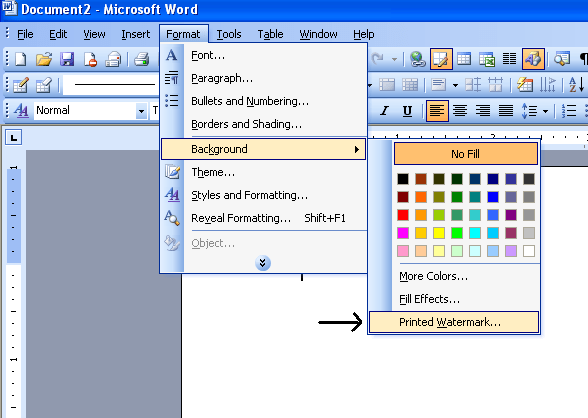
Microsoft Word or MS-Word is a word processing and documentation software initially released in 1983 by Microsoft.It is designed using C++ language providing more flexibility as it supports a number of platforms.It is extremely collaborative, user friendly and good for home,education,business and workplace use.You can use it anywhere and create anything you want like letters,resumes,articles,books and make your own notes.You can also format and transfer documented text when required or convert them into PDFs.Magic happens as you create,edit,print and share important or an urgent information anytime with in seconds.
Microsoft Power Point is a software application that is designed to provide more power to your data and information so that you can defend your view more impact fully and confidently.It gives an ever lasting impression to your designed presentations via pictorial and graphical representation of topic with in your slides making it easier to understand and for the audience.It is written in C# language and was initially released for Macintosh Computers in the year 1987.Though it initially supported Windows System but its now available for almost all Operating Systems following mac OS ,Android and i OS with a mind blowing availability in 102 languages.
The most powerful and the best tool which I believe Microsoft Corporation gifted us free is Microsoft Excel. My Friends!It is the most amazing tool for data visualization and analysis.It is basically a spreadsheet software application comprising of excellent features like charts,tables and numerous calculations originally written in C ++,C## and .NET Framework.No matter either there are simple or complex calculations,you can do it just by selecting your rows and columns,providing a decent formula and here you GO!All done for you in microseconds. I wonder how easy it is for MS Excel! And kudos to those talented and brilliant minds who created this application! First ,we all should be thankful to the founders of Office namely Bill Gates and Paul Allen who developed this corporation in 1975 which is surely in every one’s pocket today. The mind behind the creation of MS.Excel was Dan Bricklin in 1978–79. Excel was originally supported on AppleII, under the program name VisiCalc. But the man behind Excel and Word is Charles Simonyi giving us the first built versions of Office,now being called as the Father Of Excel.

Eventually,the Office family is growing daily as more advancements are being made.Currently the stats say that 1 in 7 people on planet uses Ms office which is awesome! So my dear readers! Keep using Office as it’s free and most friendly application for everyone.You can explore more as there’s no limit to increase your knowledge.In the next few years, we’ll get more surprises in this technological world.
I think you can now understand the reason why I chose this field when we have such great people who make the impossible possible. I’ll come with some more interesting facts and inspirational personalities. Until then stay connected!
Have a Good Day 🙂
Source:Google & Wikipedia.
This is an example post, originally published as part of Blogging University. Enroll in one of our ten programs, and start your blog right.
You’re going to publish a post today. Don’t worry about how your blog looks. Don’t worry if you haven’t given it a name yet, or you’re feeling overwhelmed. Just click the “New Post” button, and tell us why you’re here.
Why do this?
The post can be short or long, a personal intro to your life or a bloggy mission statement, a manifesto for the future or a simple outline of your the types of things you hope to publish.
To help you get started, here are a few questions:
You’re not locked into any of this; one of the wonderful things about blogs is how they constantly evolve as we learn, grow, and interact with one another — but it’s good to know where and why you started, and articulating your goals may just give you a few other post ideas.
Can’t think how to get started? Just write the first thing that pops into your head. Anne Lamott, author of a book on writing we love, says that you need to give yourself permission to write a “crappy first draft”. Anne makes a great point — just start writing, and worry about editing it later.
When you’re ready to publish, give your post three to five tags that describe your blog’s focus — writing, photography, fiction, parenting, food, cars, movies, sports, whatever. These tags will help others who care about your topics find you in the Reader. Make sure one of the tags is “zerotohero,” so other new bloggers can find you, too.

